Timeline View
Your whole project, mapped across time.
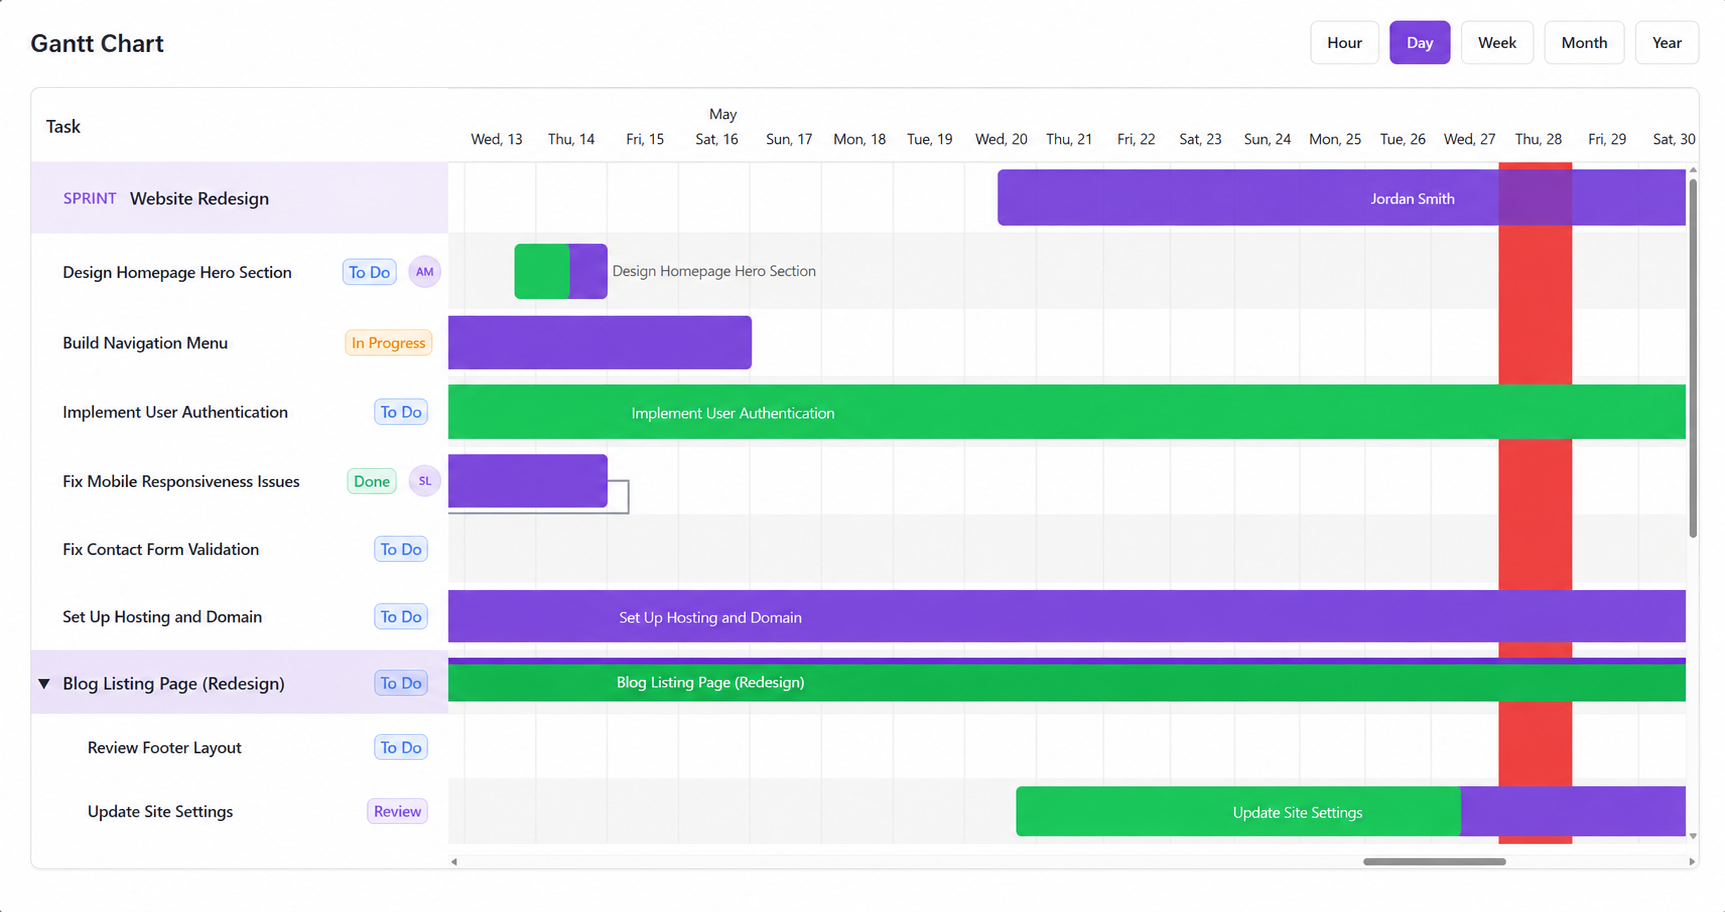
Llumo’s Gantt chart gives you a live, colour-coded timeline of every task in your project. Tasks are grouped by sprint, colour-coded by status, and laid out across a scrollable calendar so you can see exactly what’s happening — and what’s coming up.
- Tasks grouped under sprints so context is always clear
- Colour-coded bars — purple for in progress, green for to do, red for overdue
- Switch between Hour, Day, Week, Month, and Year views instantly
- Status badges on every row — To Do, In Progress, Review, Done
- Assignee avatars shown directly on the task row
- Subtasks expand inline to show full task hierarchies
Task Detail & Progress
Hover any task to see the full picture.
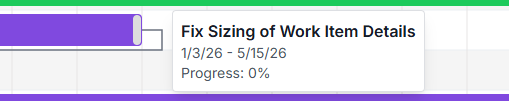
Hover over any bar on the timeline and instantly see the task name, date range, and live progress percentage. No need to click into the task — all the key info surfaces right where you’re looking.
- Task name, start date, and end date in one glance
- Live progress percentage (0–100%) tracked per task
- Works across all time views without leaving the chart
- Great for stakeholder reviews and sprint check-ins