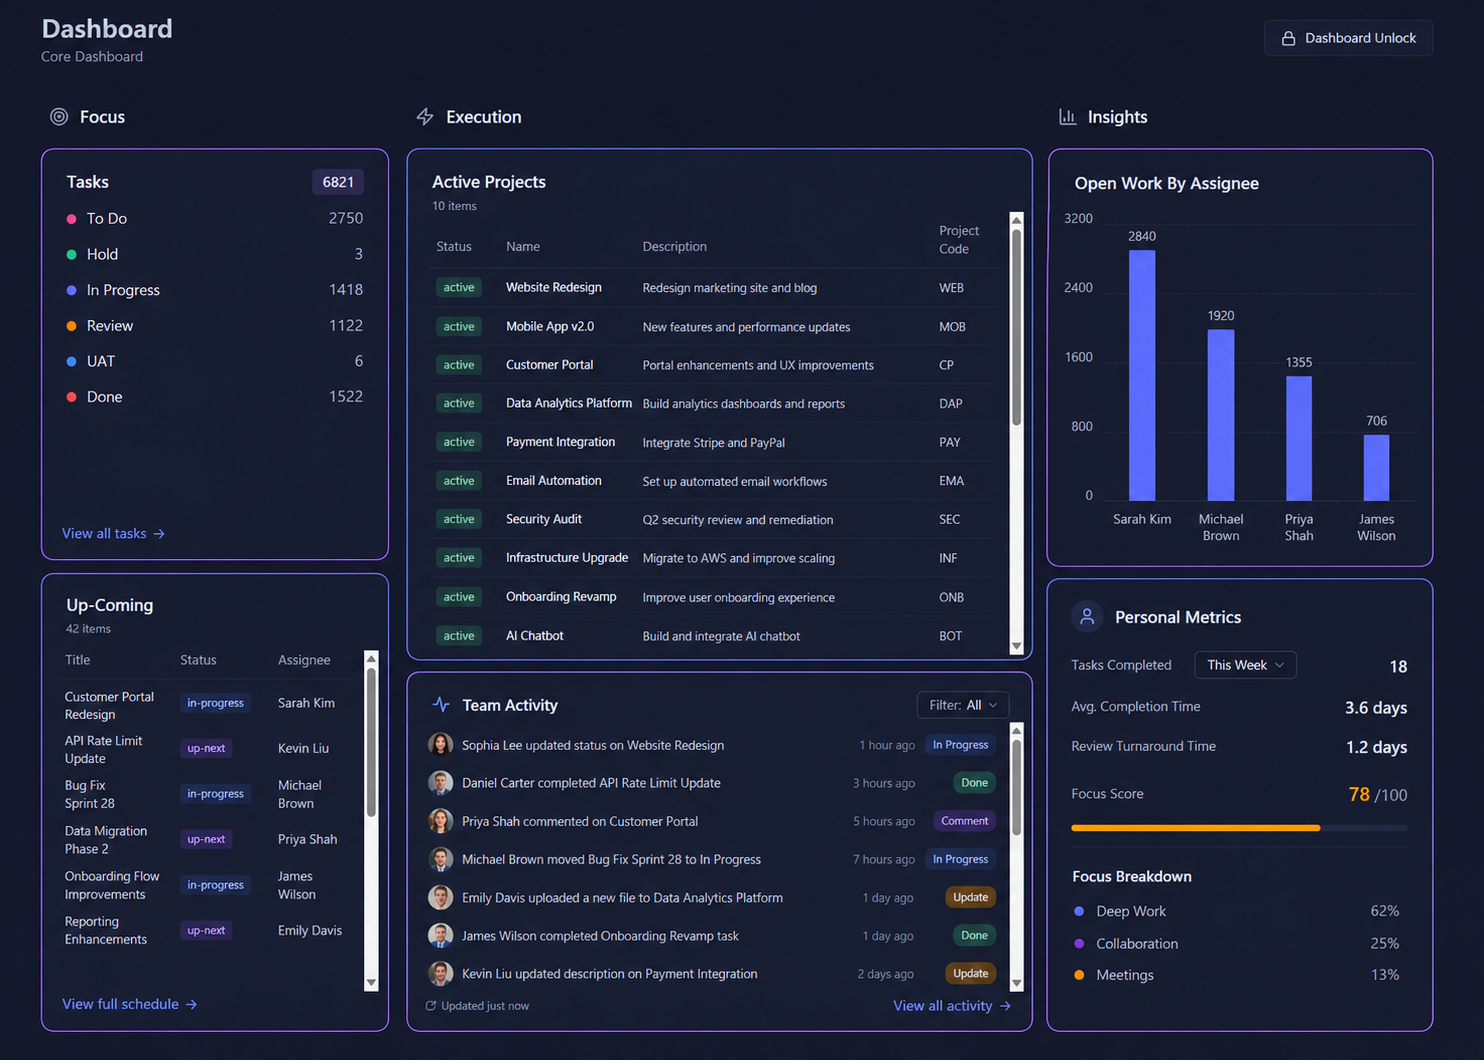
Everything your team needs, in one live view
Your core dashboard brings together Focus, Execution, and Insights in a single screen. See task breakdowns, active projects, team activity feed, and personal metrics — all updating in real time.
- Focus panel: task counts by status at a glance
- Active projects list with live status
- Team activity feed with timestamped updates
- Personal metrics: completion time, focus score
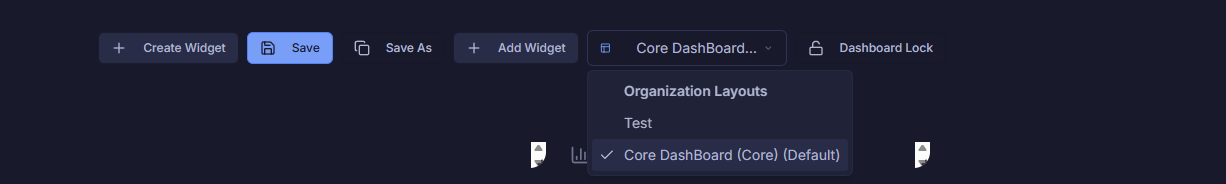
Switch between layouts instantly
Create multiple named dashboard layouts for different teams, roles, or contexts. Switch between them from the top bar — your organization's layouts are always one click away.
- Save unlimited named layouts per organization
- Quick-switch from the dashboard toolbar
- Set a default layout for the whole org
- Create, Save As, and duplicate layouts easily
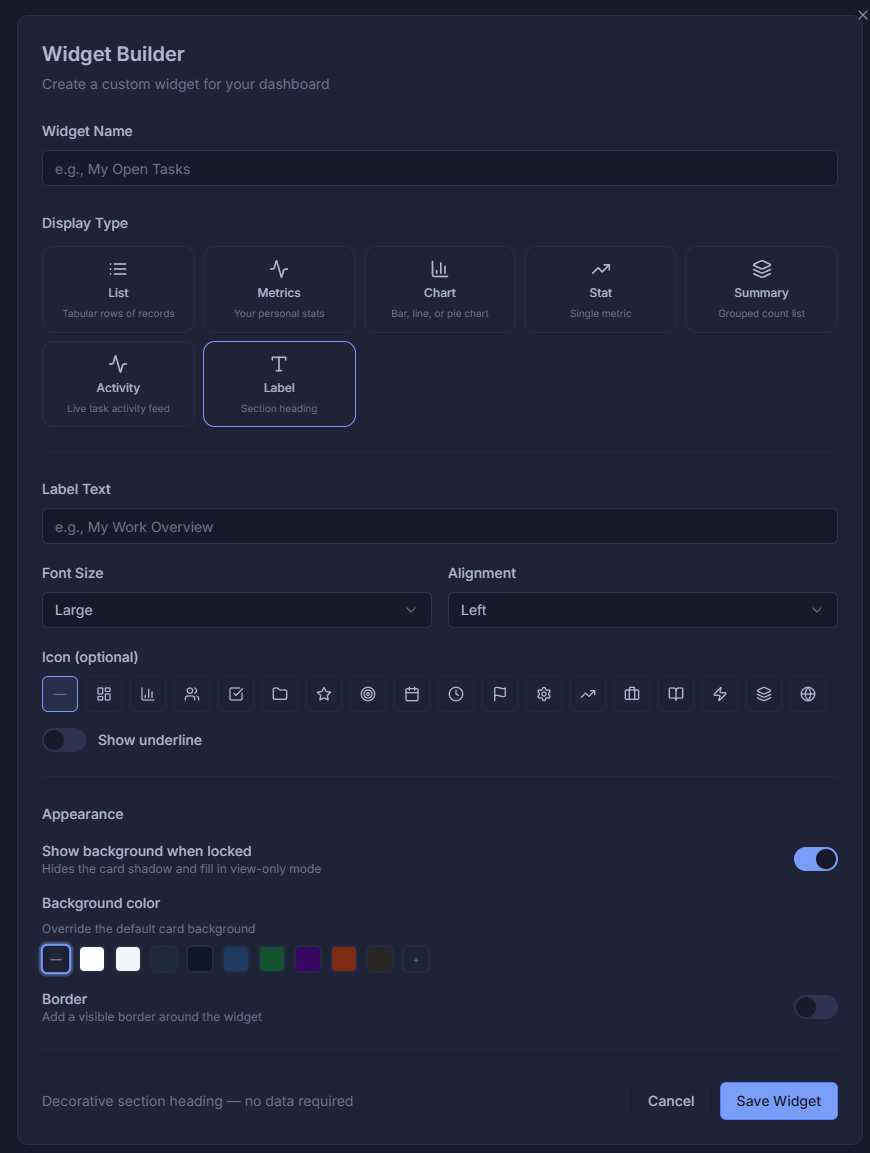
Build any widget you need in seconds
Choose from 8 display types — List, Metrics, Chart, Stat, Summary, Activity, and Label. Customize the name, appearance, background color, border, and more. No code required.
- 8 widget types: List, Chart, Stat, Metrics & more
- Label widgets for section headings & organization
- Custom background colors and border options
- Toggle visibility when dashboard is locked
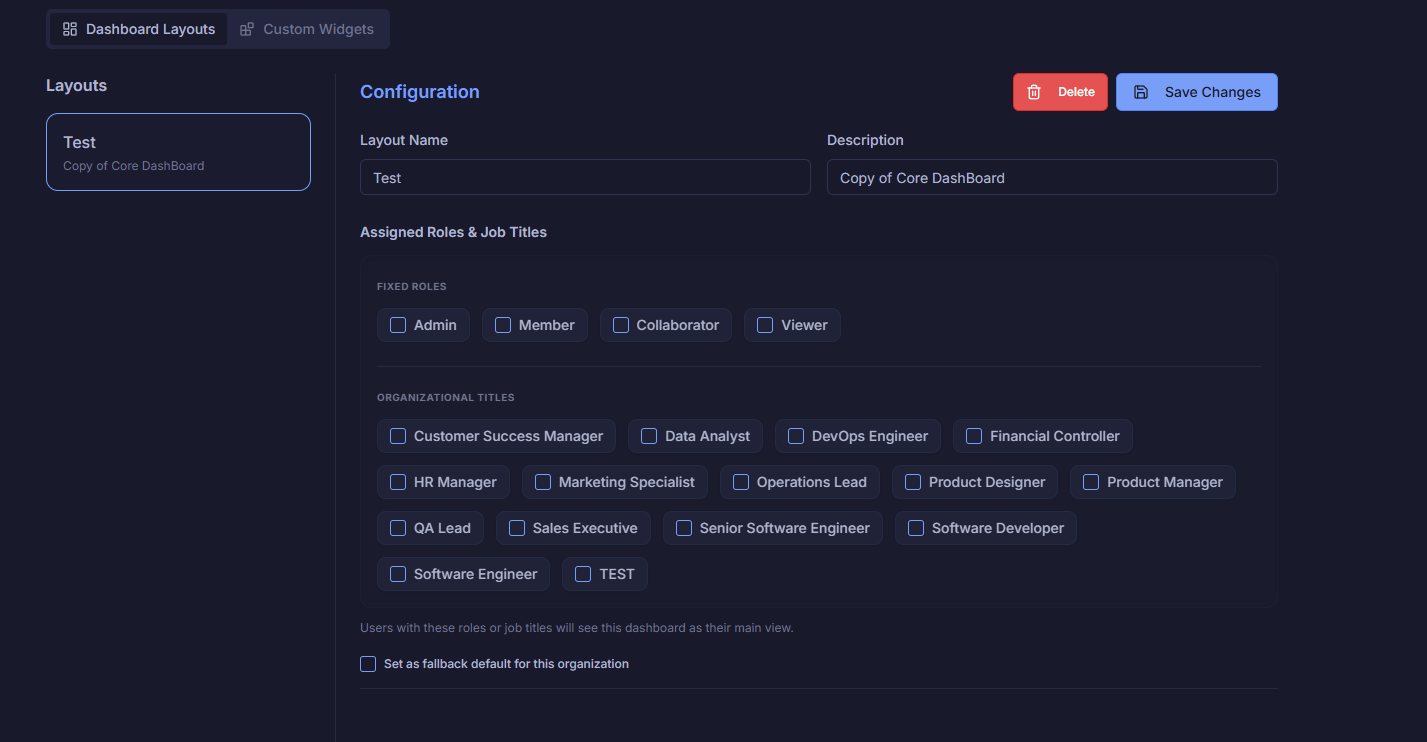
Assign dashboards by role or job title
Configure who sees which dashboard layout. Assign layouts to fixed roles (Admin, Member, Collaborator, Viewer) or specific organizational job titles — so every team member gets the view that's relevant to them.
- Assign by fixed role: Admin, Member, Viewer
- Assign by job title: DevOps, PM, Designer & more
- Set a fallback default for the whole organization
- Manage custom widgets alongside layouts
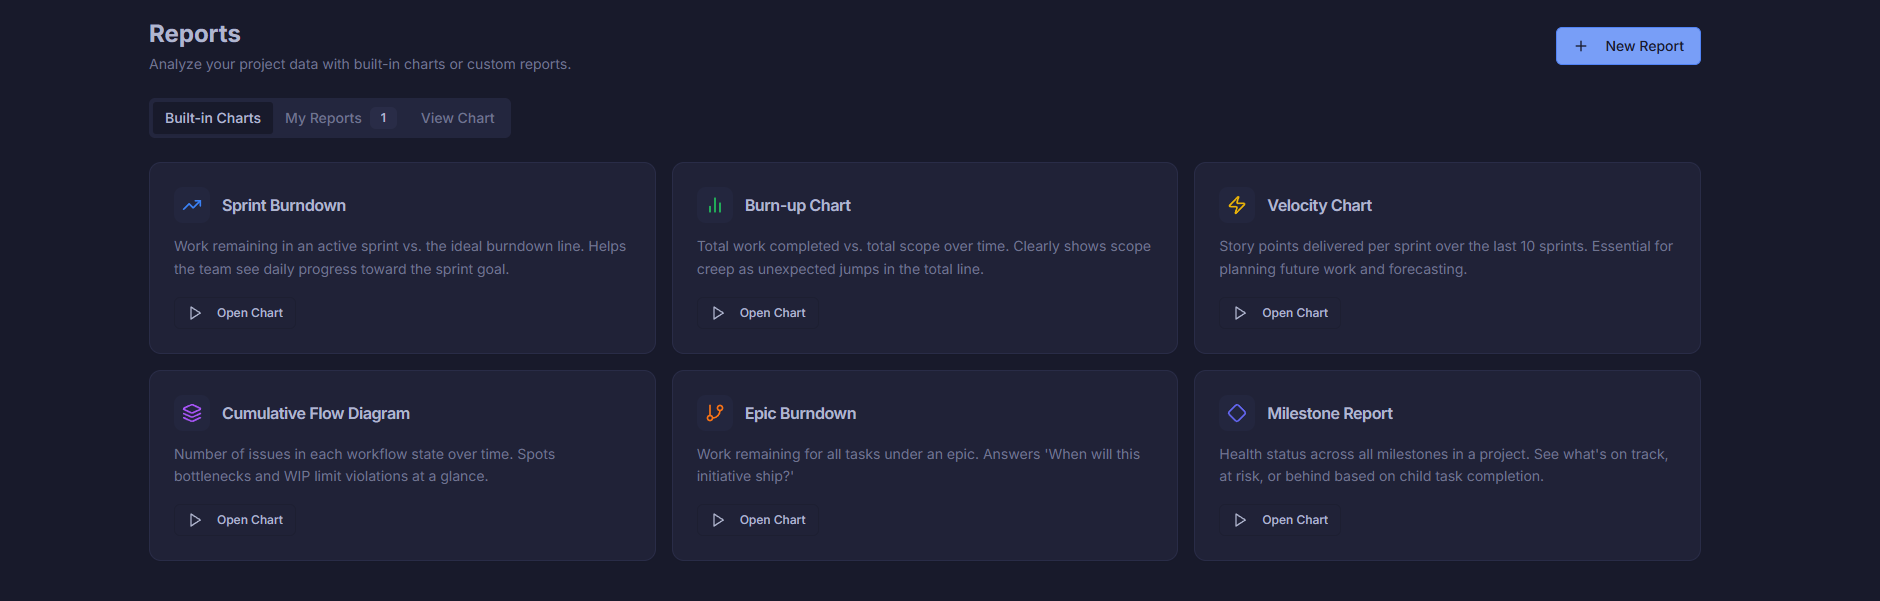
Six powerful reports, ready out of the box
No setup needed. Sprint Burndown, Burn-up, Velocity, Cumulative Flow, Epic Burndown, and Milestone Report are all built in. Open any chart instantly and start analyzing your project data.
- Sprint Burndown — daily progress vs. ideal line
- Burn-up Chart — scope vs. completed over time
- Velocity Chart — story points per sprint
- Cumulative Flow, Epic Burndown & Milestone Report
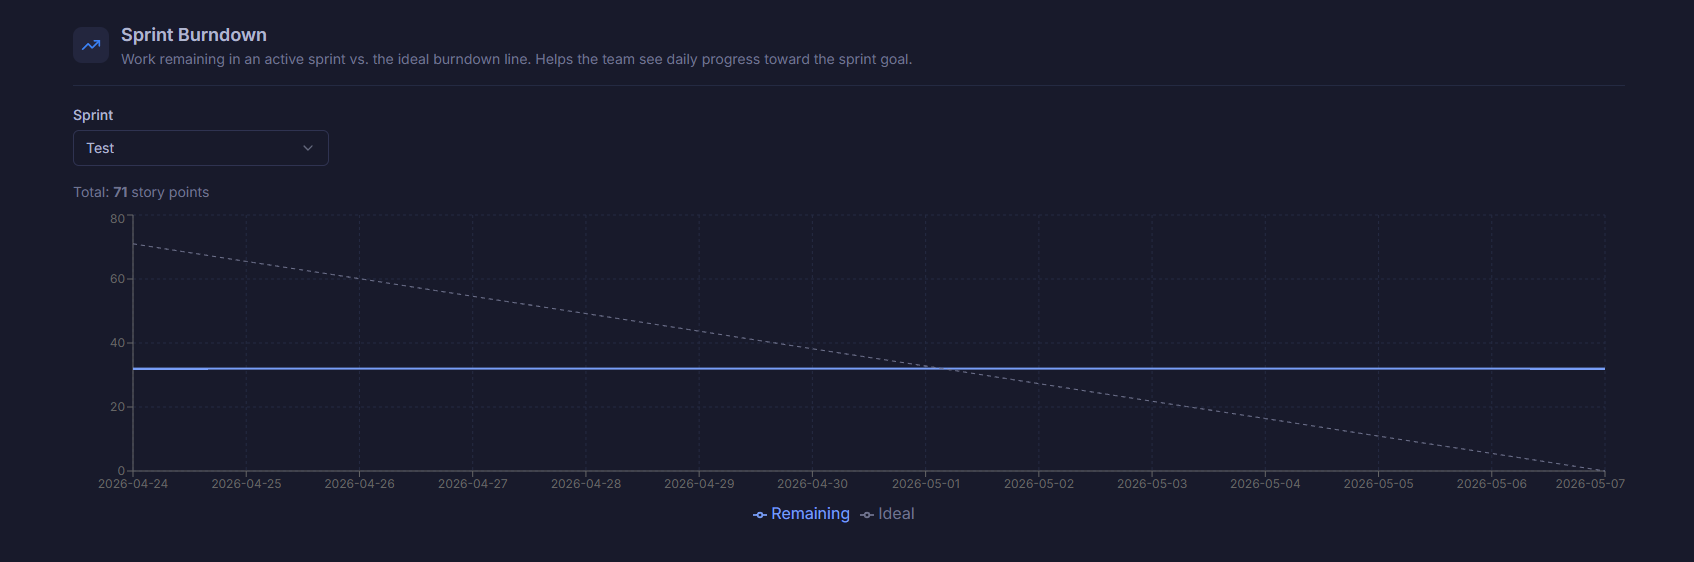
See exactly where your sprint stands
Track work remaining against the ideal burndown line for any sprint. Instantly spot when the team is falling behind so you can course-correct before the sprint ends.
- Remaining vs. Ideal line plotted daily
- Select any sprint from the dropdown
- Total story points shown at a glance
- Spots stalling or scope creep immediately
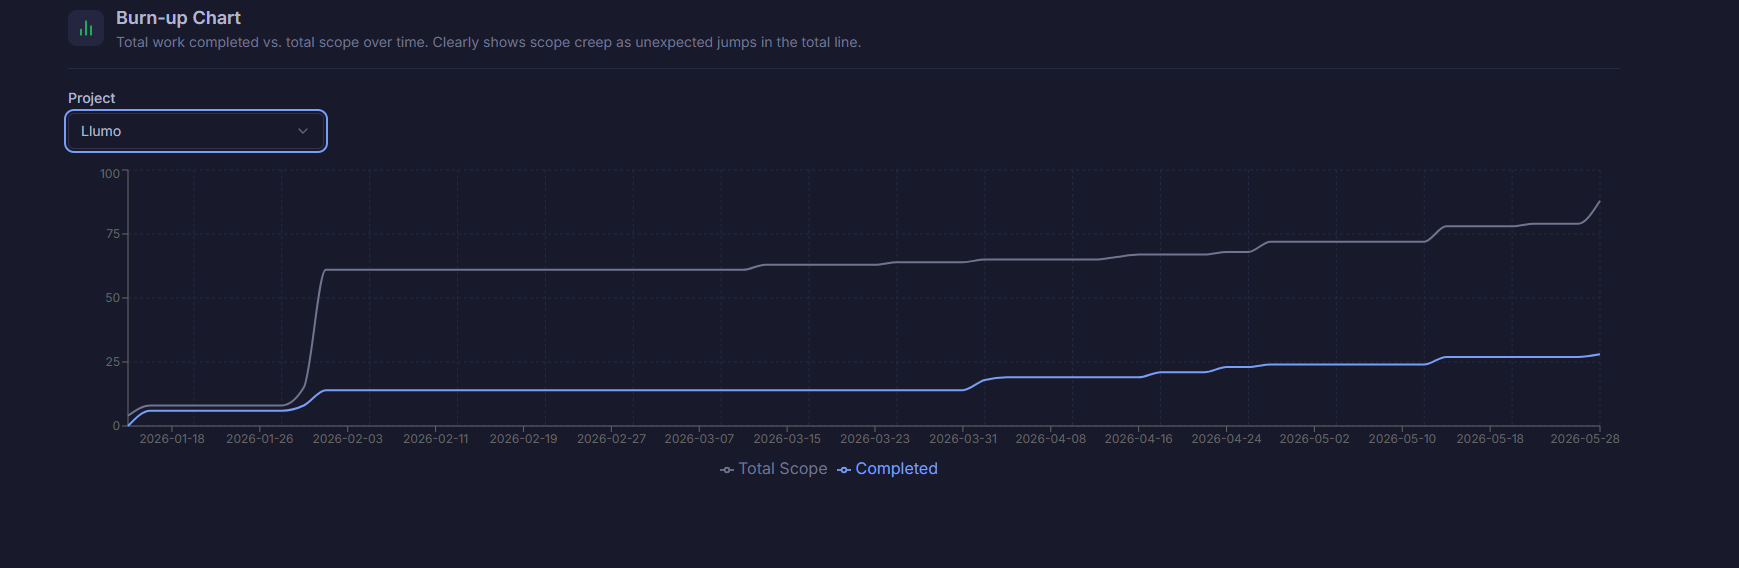
Watch scope and completion grow over time
The Burn-up Chart plots total scope alongside completed work across your entire project timeline. Instantly see scope creep as the total line jumps — and track how your team is closing the gap.
- Total Scope vs. Completed lines over time
- Filter by any project in your workspace
- Reveals scope creep as unexpected line jumps
- Full project timeline from start to today
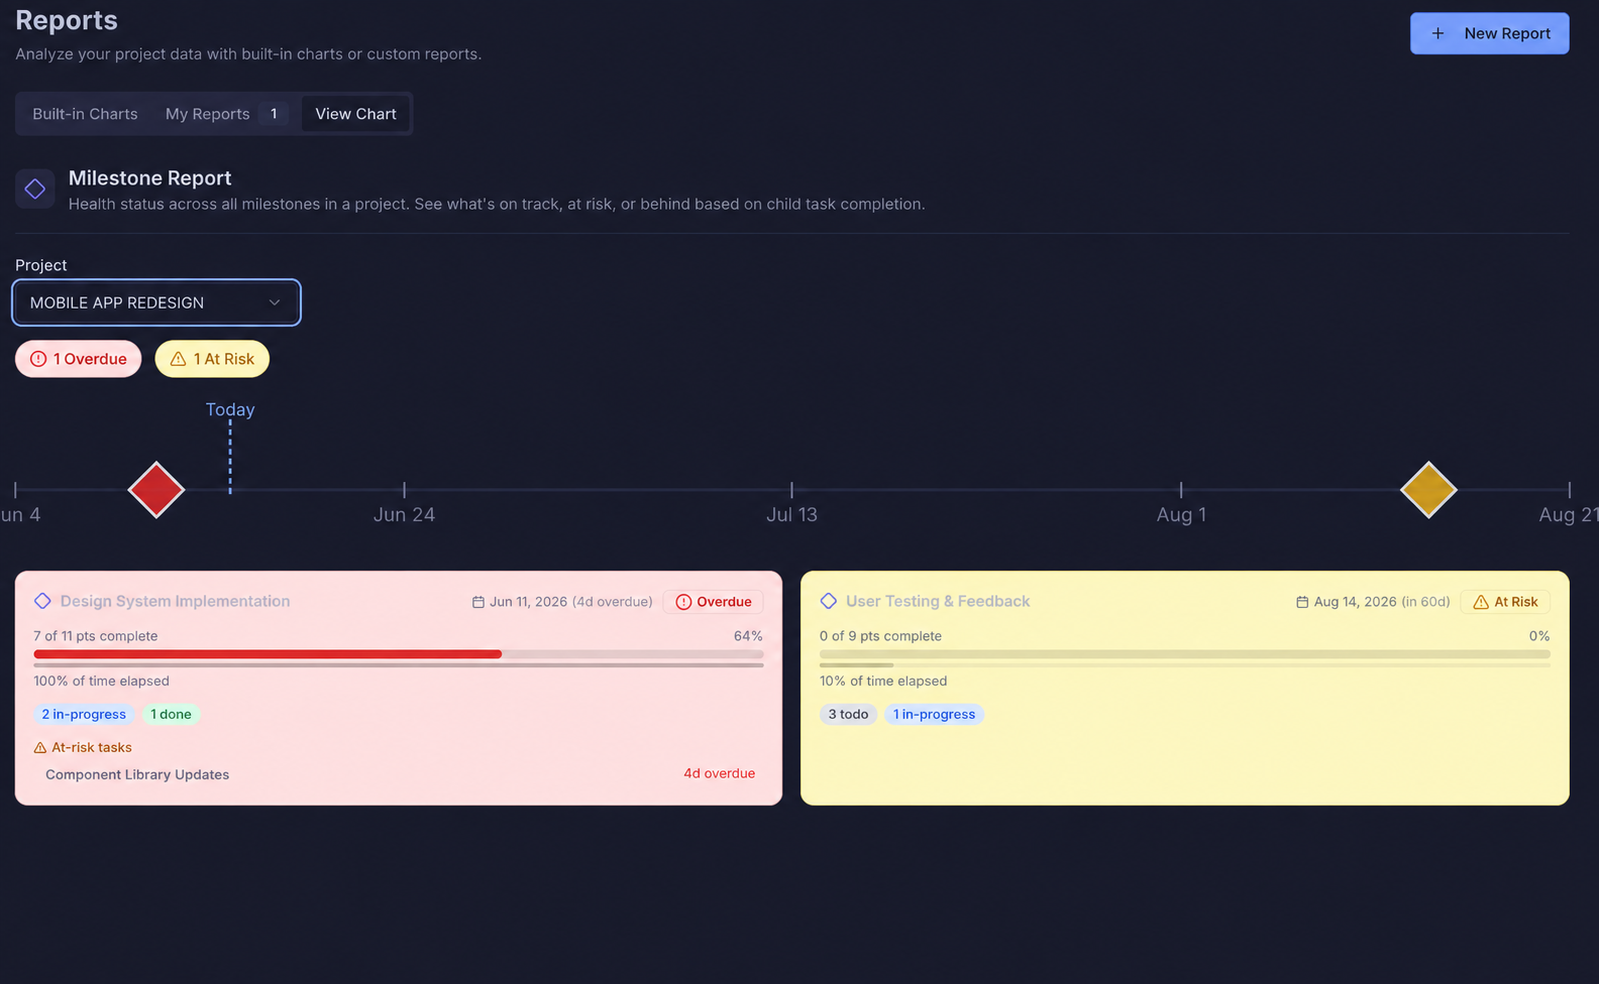
Track every milestone across your projects
The Milestone Report gives you a clear view of every project milestone — what's on track, what's overdue, and what's coming up. Stay ahead of key delivery dates and keep stakeholders informed at a glance.
- View all milestones across every project
- See completion status and due dates at a glance
- Identify overdue and at-risk milestones instantly
- Filter by project, status, or date range
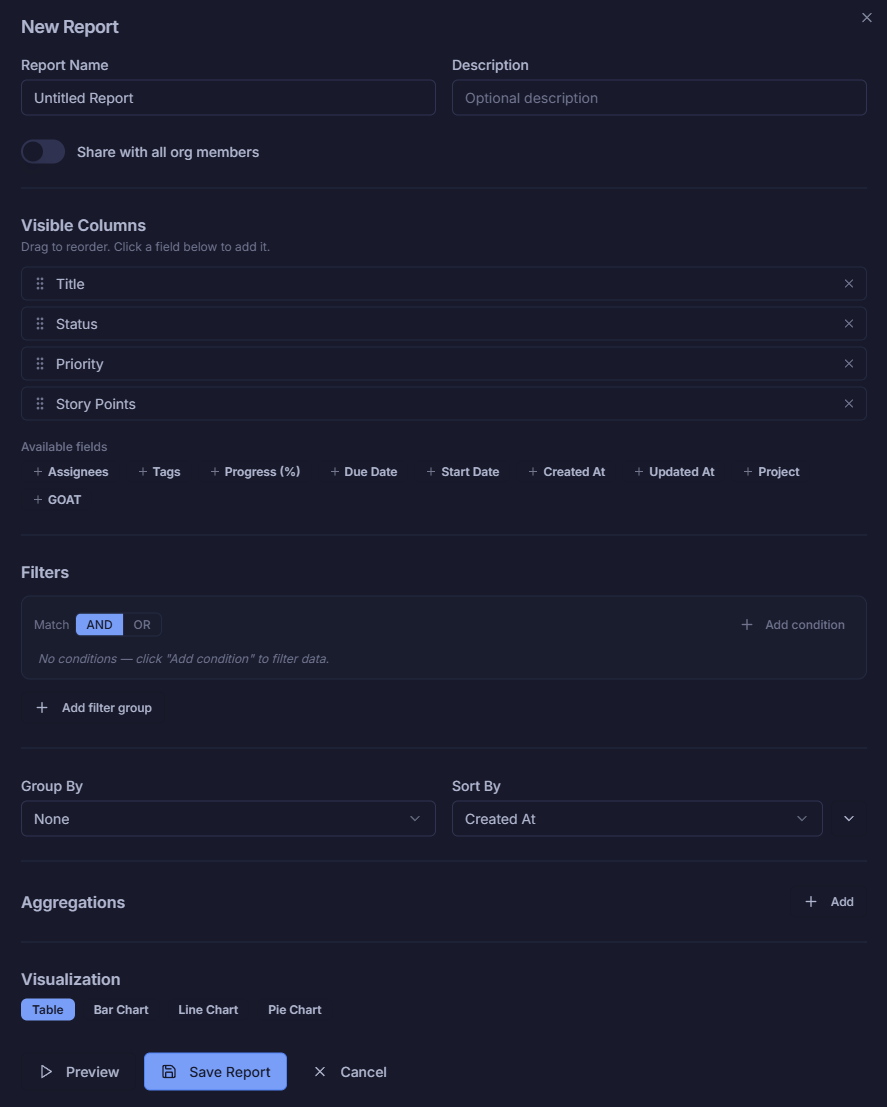
Build any custom report your team needs
Name your report, choose visible columns, add filters with AND/OR logic, group and sort by any field, and choose your visualization — Table, Bar, Line, or Pie Chart. Share with the whole org in one toggle.
- Drag-to-reorder visible columns
- AND/OR filter groups with multiple conditions
- Aggregations for sums, counts & averages
- Table, Bar Chart, Line Chart or Pie Chart output